PhenoGenX – Model Performance Dashboard
Comprehensive evaluation of ensemble ML models for HIV-1 drug resistance prediction
Cross-Validated Training Performance
Ensemble model performance metrics based on 5-fold cross-validation. CRPS (Composite Ranking Performance Score) combines R², correlation, MAE, accuracy, and stability for balanced model selection.
Model Performance by Drug
| Drug | Best R² | Best CRPS | Mutations | Samples |
|---|---|---|---|---|
|
ABC
Antiretroviral drug
|
0.53
Good
|
64.2
Good
|
193
Unique mutations
|
2233
Training samples
|
|
D4T
Antiretroviral drug
|
0.76
Excellent
|
78.1
Excellent
|
209
Unique mutations
|
2379
Training samples
|
|
NVP
Antiretroviral drug
|
0.78
Excellent
|
78.3
Excellent
|
204
Unique mutations
|
2454
Training samples
|
|
3TC
Antiretroviral drug
|
0.84
Excellent
|
77.8
Excellent
|
255
Unique mutations
|
2706
Training samples
|
|
EFV
Antiretroviral drug
|
0.79
Excellent
|
76.4
Excellent
|
212
Unique mutations
|
2567
Training samples
|
|
AZT
Antiretroviral drug
|
0.74
Excellent
|
76.9
Excellent
|
207
Unique mutations
|
2383
Training samples
|
|
DDI
Antiretroviral drug
|
0.58
Good
|
72.6
Good
|
209
Unique mutations
|
2380
Training samples
|
|
TDF
Antiretroviral drug
|
0.70
Excellent
|
79.5
Excellent
|
180
Unique mutations
|
2014
Training samples
|
|
ETR
Antiretroviral drug
|
0.69
Good
|
70.2
Good
|
94
Unique mutations
|
1195
Training samples
|
|
FTC
Antiretroviral drug
|
0.68
Good
|
73.4
Good
|
48
Unique mutations
|
556
Training samples
|
|
EVG
Antiretroviral drug
|
0.74
Excellent
|
77.3
Excellent
|
89
Unique mutations
|
1624
Training samples
|
|
RAL
Antiretroviral drug
|
0.72
Excellent
|
71.7
Good
|
93
Unique mutations
|
1690
Training samples
|
|
DTG
Antiretroviral drug
|
0.78
Excellent
|
77.2
Excellent
|
74
Unique mutations
|
962
Training samples
|
|
BIC
Antiretroviral drug
|
0.65
Good
|
69.7
Good
|
46
Unique mutations
|
609
Training samples
|
|
NFV
Antiretroviral drug
|
0.58
Good
|
76.7
Excellent
|
197
Unique mutations
|
2418
Training samples
|
|
SQV
Antiretroviral drug
|
0.68
Good
|
71.8
Good
|
195
Unique mutations
|
2368
Training samples
|
|
FPV
Antiretroviral drug
|
0.81
Excellent
|
75.0
Good
|
195
Unique mutations
|
2321
Training samples
|
|
IDV
Antiretroviral drug
|
0.72
Excellent
|
77.7
Excellent
|
191
Unique mutations
|
2361
Training samples
|
|
RTV
Antiretroviral drug
|
0.81
Excellent
|
83.7
Excellent
|
187
Unique mutations
|
2331
Training samples
|
|
LPV
Antiretroviral drug
|
0.79
Excellent
|
81.5
Excellent
|
176
Unique mutations
|
2048
Training samples
|
|
TPV
Antiretroviral drug
|
0.91
Excellent
|
73.2
Good
|
122
Unique mutations
|
1327
Training samples
|
|
ATV
Antiretroviral drug
|
0.55
Good
|
74.6
Good
|
154
Unique mutations
|
1661
Training samples
|
Performance Classification Guidelines
CRPS Scoring System:
Excellent (CRPS > 75)
Top-quartile performance with high accuracy and stability across all metrics. Suitable for clinical decision support.
Good (CRPS 60-75)
Reliable performance with balanced metrics across all dimensions. Acceptable for clinical use with appropriate monitoring.
Needs Improvement (CRPS < 60)
Requires model refinement, additional training data, or feature engineering to achieve clinical reliability standards.
About CRPS Scoring System
The Composite Ranking Performance Score (CRPS) is a comprehensive metric designed to evaluate machine learning models across multiple dimensions simultaneously. Unlike single metrics, CRPS provides a balanced assessment of model quality by integrating:
Independent Clinical Validation
Categorical performance metrics from independent validation datasets. Sensitivity and specificity are reported separately for Susceptible (S) and Resistant (R) classifications to reflect differential clinical risks.
Validation Performance by Drug
| Drug | N | Susceptible (S) Metrics | Resistant (R) Metrics | ||||||
|---|---|---|---|---|---|---|---|---|---|
| Samples | Sens | Spec | PPV | NPV | Sens | Spec | PPV | NPV | |
|
3TC
Drug
|
655
Samples
|
94%
Sensitivity
|
85%
Specificity
|
61%
PPV
|
98%
NPV
|
94%
Sensitivity
|
98%
Specificity
|
99%
PPV
|
93%
NPV
|
|
ABC
Drug
|
462
Samples
|
72%
Sensitivity
|
91%
Specificity
|
87%
PPV
|
80%
NPV
|
11%
Sensitivity
|
99%
Specificity
|
89%
PPV
|
53%
NPV
|
|
ATV
Drug
|
290
Samples
|
70%
Sensitivity
|
84%
Specificity
|
67%
PPV
|
86%
NPV
|
61%
Sensitivity
|
83%
Specificity
|
71%
PPV
|
76%
NPV
|
|
AZT
Drug
|
607
Samples
|
73%
Sensitivity
|
96%
Specificity
|
92%
PPV
|
84%
NPV
|
95%
Sensitivity
|
67%
Specificity
|
61%
PPV
|
96%
NPV
|
|
BIC
Drug
|
540
Samples
|
81%
Sensitivity
|
77%
Specificity
|
92%
PPV
|
55%
NPV
|
30%
Sensitivity
|
99%
Specificity
|
87%
PPV
|
88%
NPV
|
|
D4T
Drug
|
611
Samples
|
87%
Sensitivity
|
76%
Specificity
|
50%
PPV
|
96%
NPV
|
46%
Sensitivity
|
95%
Specificity
|
78%
PPV
|
83%
NPV
|
|
DDI
Drug
|
609
Samples
|
80%
Sensitivity
|
75%
Specificity
|
88%
PPV
|
63%
NPV
|
10%
Sensitivity
|
99%
Specificity
|
84%
PPV
|
77%
NPV
|
|
DTG
Drug
|
889
Samples
|
77%
Sensitivity
|
81%
Specificity
|
95%
PPV
|
41%
NPV
|
47%
Sensitivity
|
97%
Specificity
|
59%
PPV
|
94%
NPV
|
|
EFV
Drug
|
691
Samples
|
95%
Sensitivity
|
55%
Specificity
|
54%
PPV
|
95%
NPV
|
73%
Sensitivity
|
97%
Specificity
|
94%
PPV
|
83%
NPV
|
|
EVG
Drug
|
1532
Samples
|
97%
Sensitivity
|
40%
Specificity
|
3%
PPV
|
100%
NPV
|
72%
Sensitivity
|
95%
Specificity
|
86%
PPV
|
88%
NPV
|
|
FPV
Drug
|
797
Samples
|
92%
Sensitivity
|
69%
Specificity
|
37%
PPV
|
98%
NPV
|
72%
Sensitivity
|
92%
Specificity
|
86%
PPV
|
83%
NPV
|
|
IDV
Drug
|
801
Samples
|
94%
Sensitivity
|
92%
Specificity
|
90%
PPV
|
96%
NPV
|
36%
Sensitivity
|
98%
Specificity
|
95%
PPV
|
54%
NPV
|
|
LPV
Drug
|
501
Samples
|
91%
Sensitivity
|
94%
Specificity
|
87%
PPV
|
96%
NPV
|
81%
Sensitivity
|
85%
Specificity
|
85%
PPV
|
81%
NPV
|
|
NFV
Drug
|
836
Samples
|
89%
Sensitivity
|
95%
Specificity
|
90%
PPV
|
94%
NPV
|
86%
Sensitivity
|
86%
Specificity
|
83%
PPV
|
88%
NPV
|
|
NVP
Drug
|
706
Samples
|
98%
Sensitivity
|
84%
Specificity
|
88%
PPV
|
98%
NPV
|
83%
Sensitivity
|
96%
Specificity
|
94%
PPV
|
89%
NPV
|
|
RAL
Drug
|
1636
Samples
|
100%
Sensitivity
|
56%
Specificity
|
2%
PPV
|
100%
NPV
|
93%
Sensitivity
|
85%
Specificity
|
76%
PPV
|
96%
NPV
|
|
RTV
Drug
|
802
Samples
|
96%
Sensitivity
|
80%
Specificity
|
62%
PPV
|
98%
NPV
|
92%
Sensitivity
|
87%
Specificity
|
85%
PPV
|
93%
NPV
|
|
SQV
Drug
|
824
Samples
|
86%
Sensitivity
|
89%
Specificity
|
91%
PPV
|
83%
NPV
|
51%
Sensitivity
|
94%
Specificity
|
77%
PPV
|
81%
NPV
|
|
TDF
Drug
|
296
Samples
|
89%
Sensitivity
|
54%
Specificity
|
30%
PPV
|
96%
NPV
|
14%
Sensitivity
|
94%
Specificity
|
63%
PPV
|
62%
NPV
|
|
TPV
Drug
|
148
Samples
|
44%
Sensitivity
|
88%
Specificity
|
90%
PPV
|
36%
NPV
|
40%
Sensitivity
|
68%
Specificity
|
31%
PPV
|
75%
NPV
|
Clinical Interpretation Guidance
For Susceptible (S) Classification: High NPV(S) ensures patients predicted as susceptible are truly susceptible, reducing risk of ineffective treatment. NPV(S) > 95% indicates excellent safety profile.
For Resistant (R) Classification: High Sens(R) ensures resistance cases are not missed, preventing treatment failure. Sens(R) > 90% is ideal for clinical use.
Color Coding:
Key Safety Metrics:
- Focus on NPV(S) for safe treatment selection
- Prioritize Sens(R) for resistance detection
- PPV(R) critical for avoiding unnecessary treatment changes
Validation Visualizations
Performance visualizations and diagnostic plots from independent validation datasets. These visualizations provide comprehensive insights into model performance across different metrics.
ROC AUC Analysis
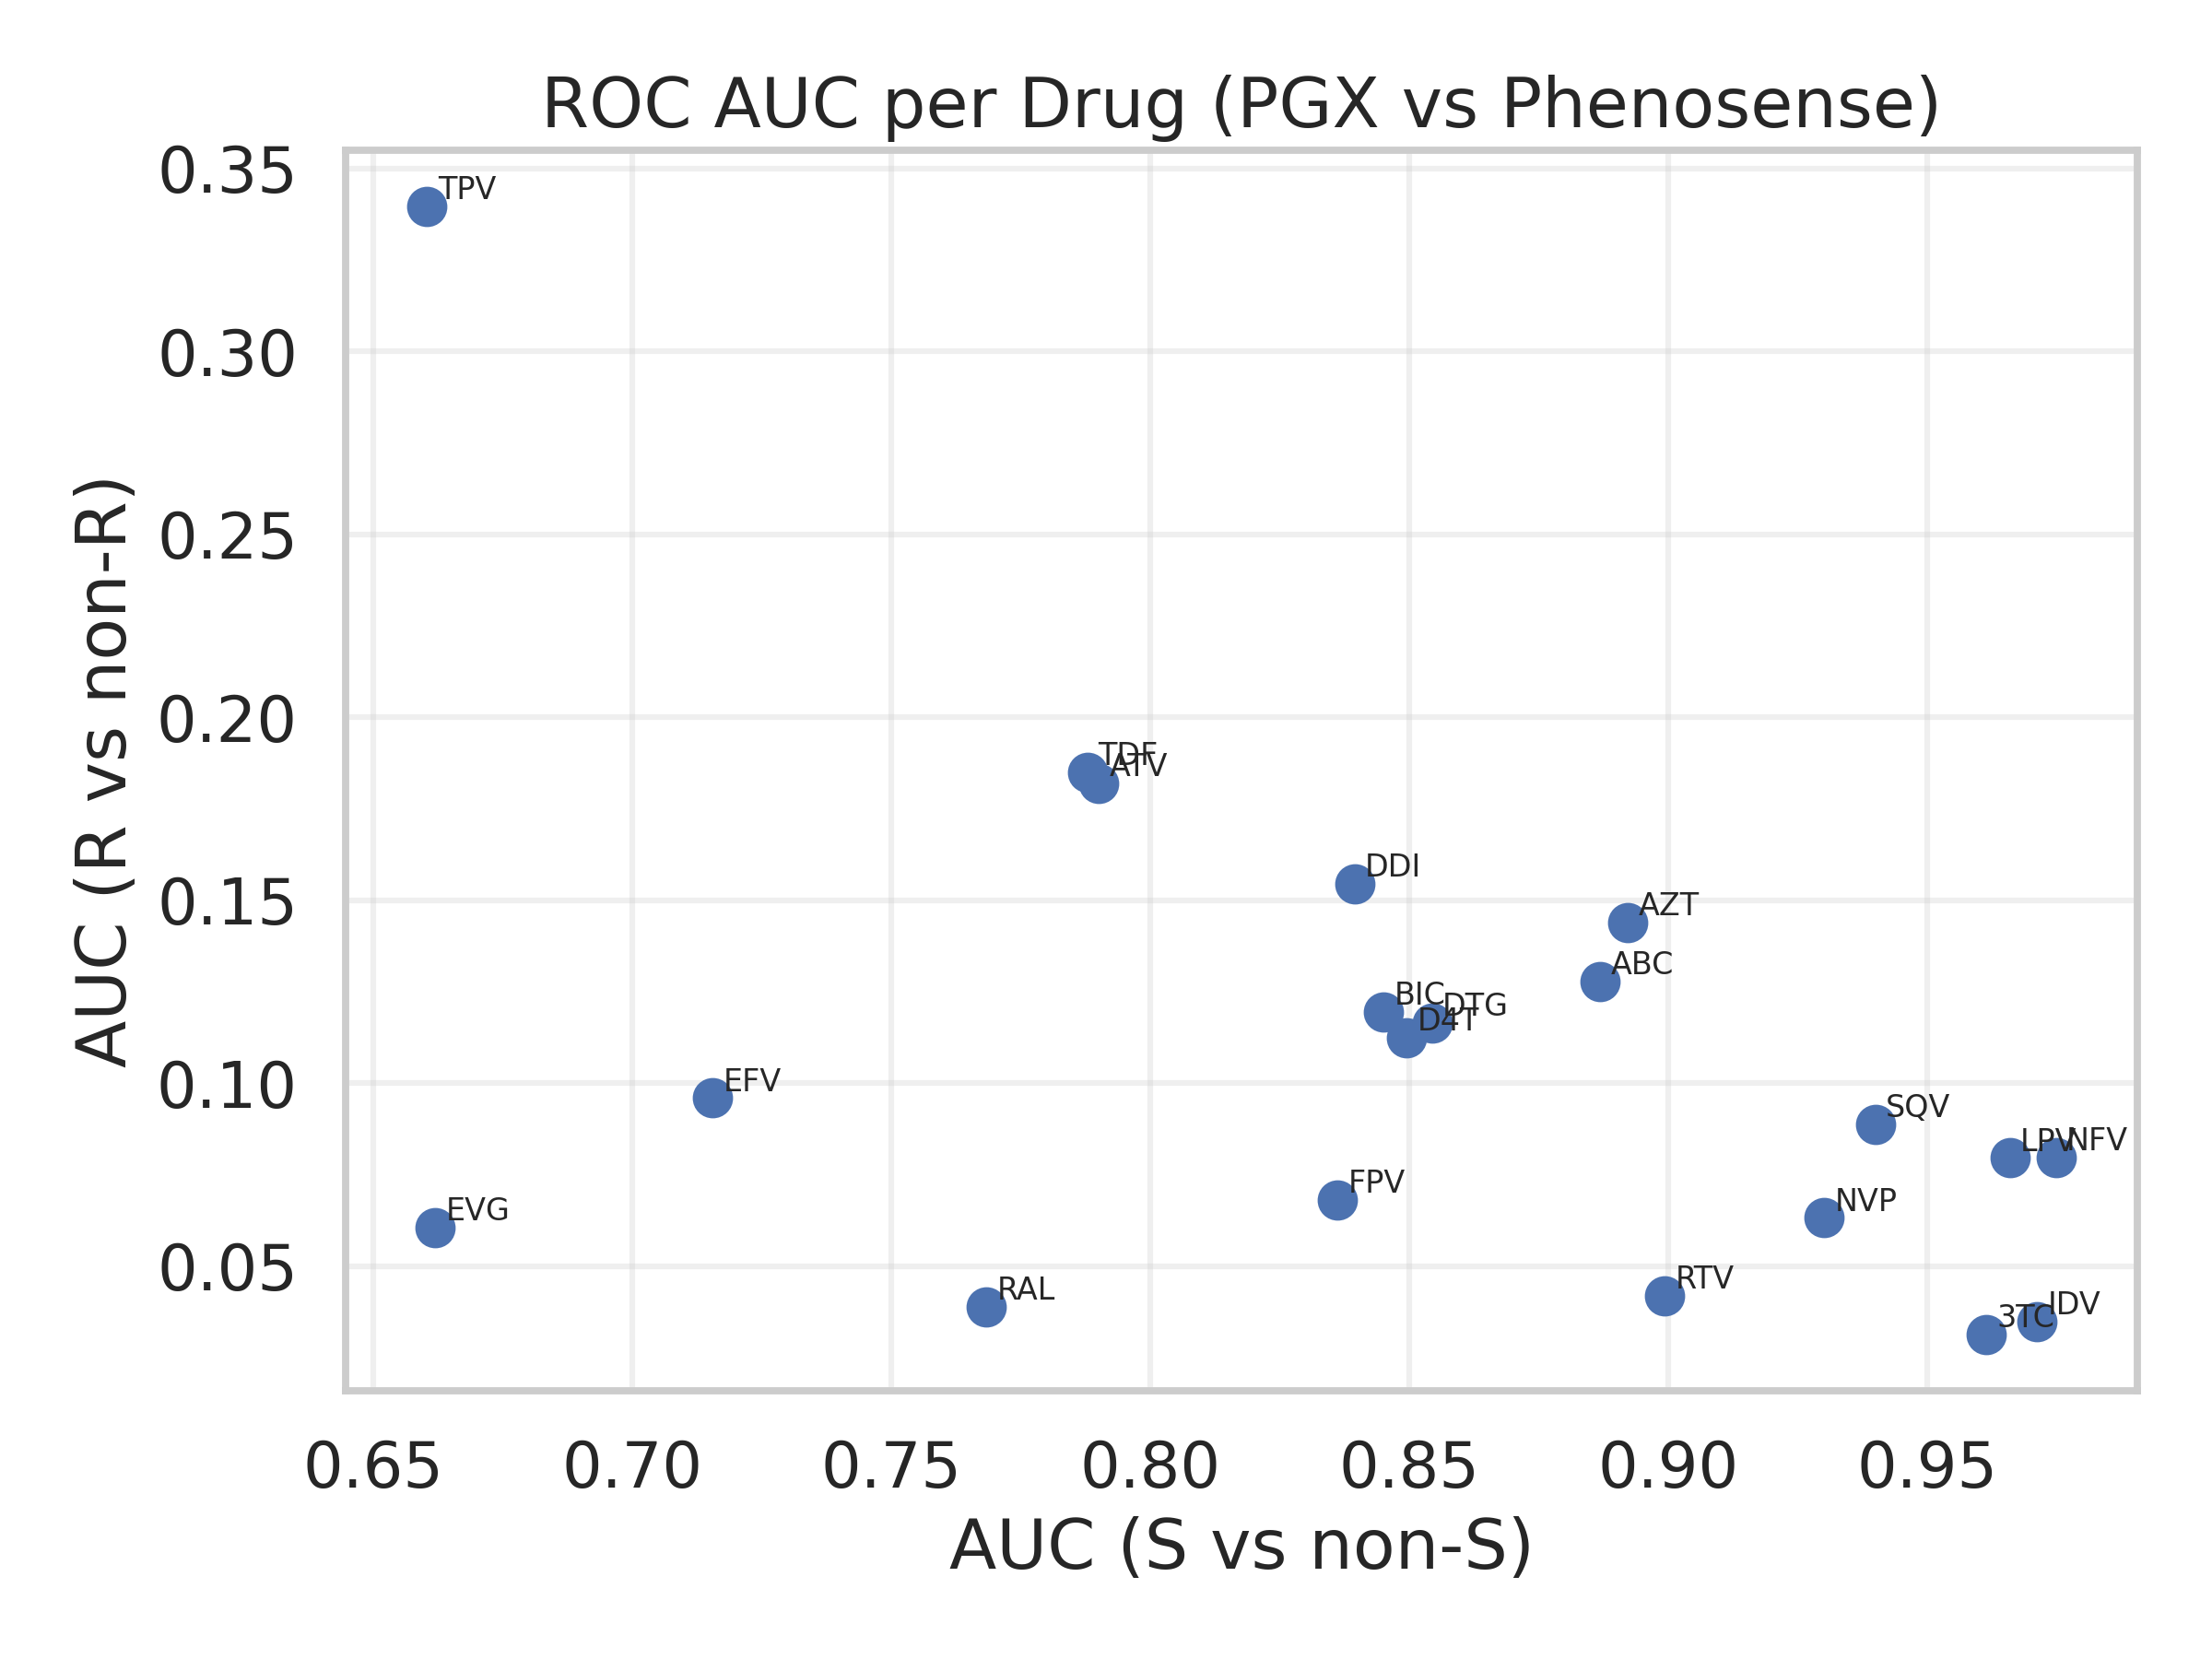
ROC curves and AUC scores across different antiretroviral drug classes. Demonstrates diagnostic performance trade-offs between sensitivity and specificity.
Model Calibration Analysis

Comparison of predicted probabilities against observed frequencies. Assesses model calibration and reliability of confidence estimates.
Threshold Optimization Analysis
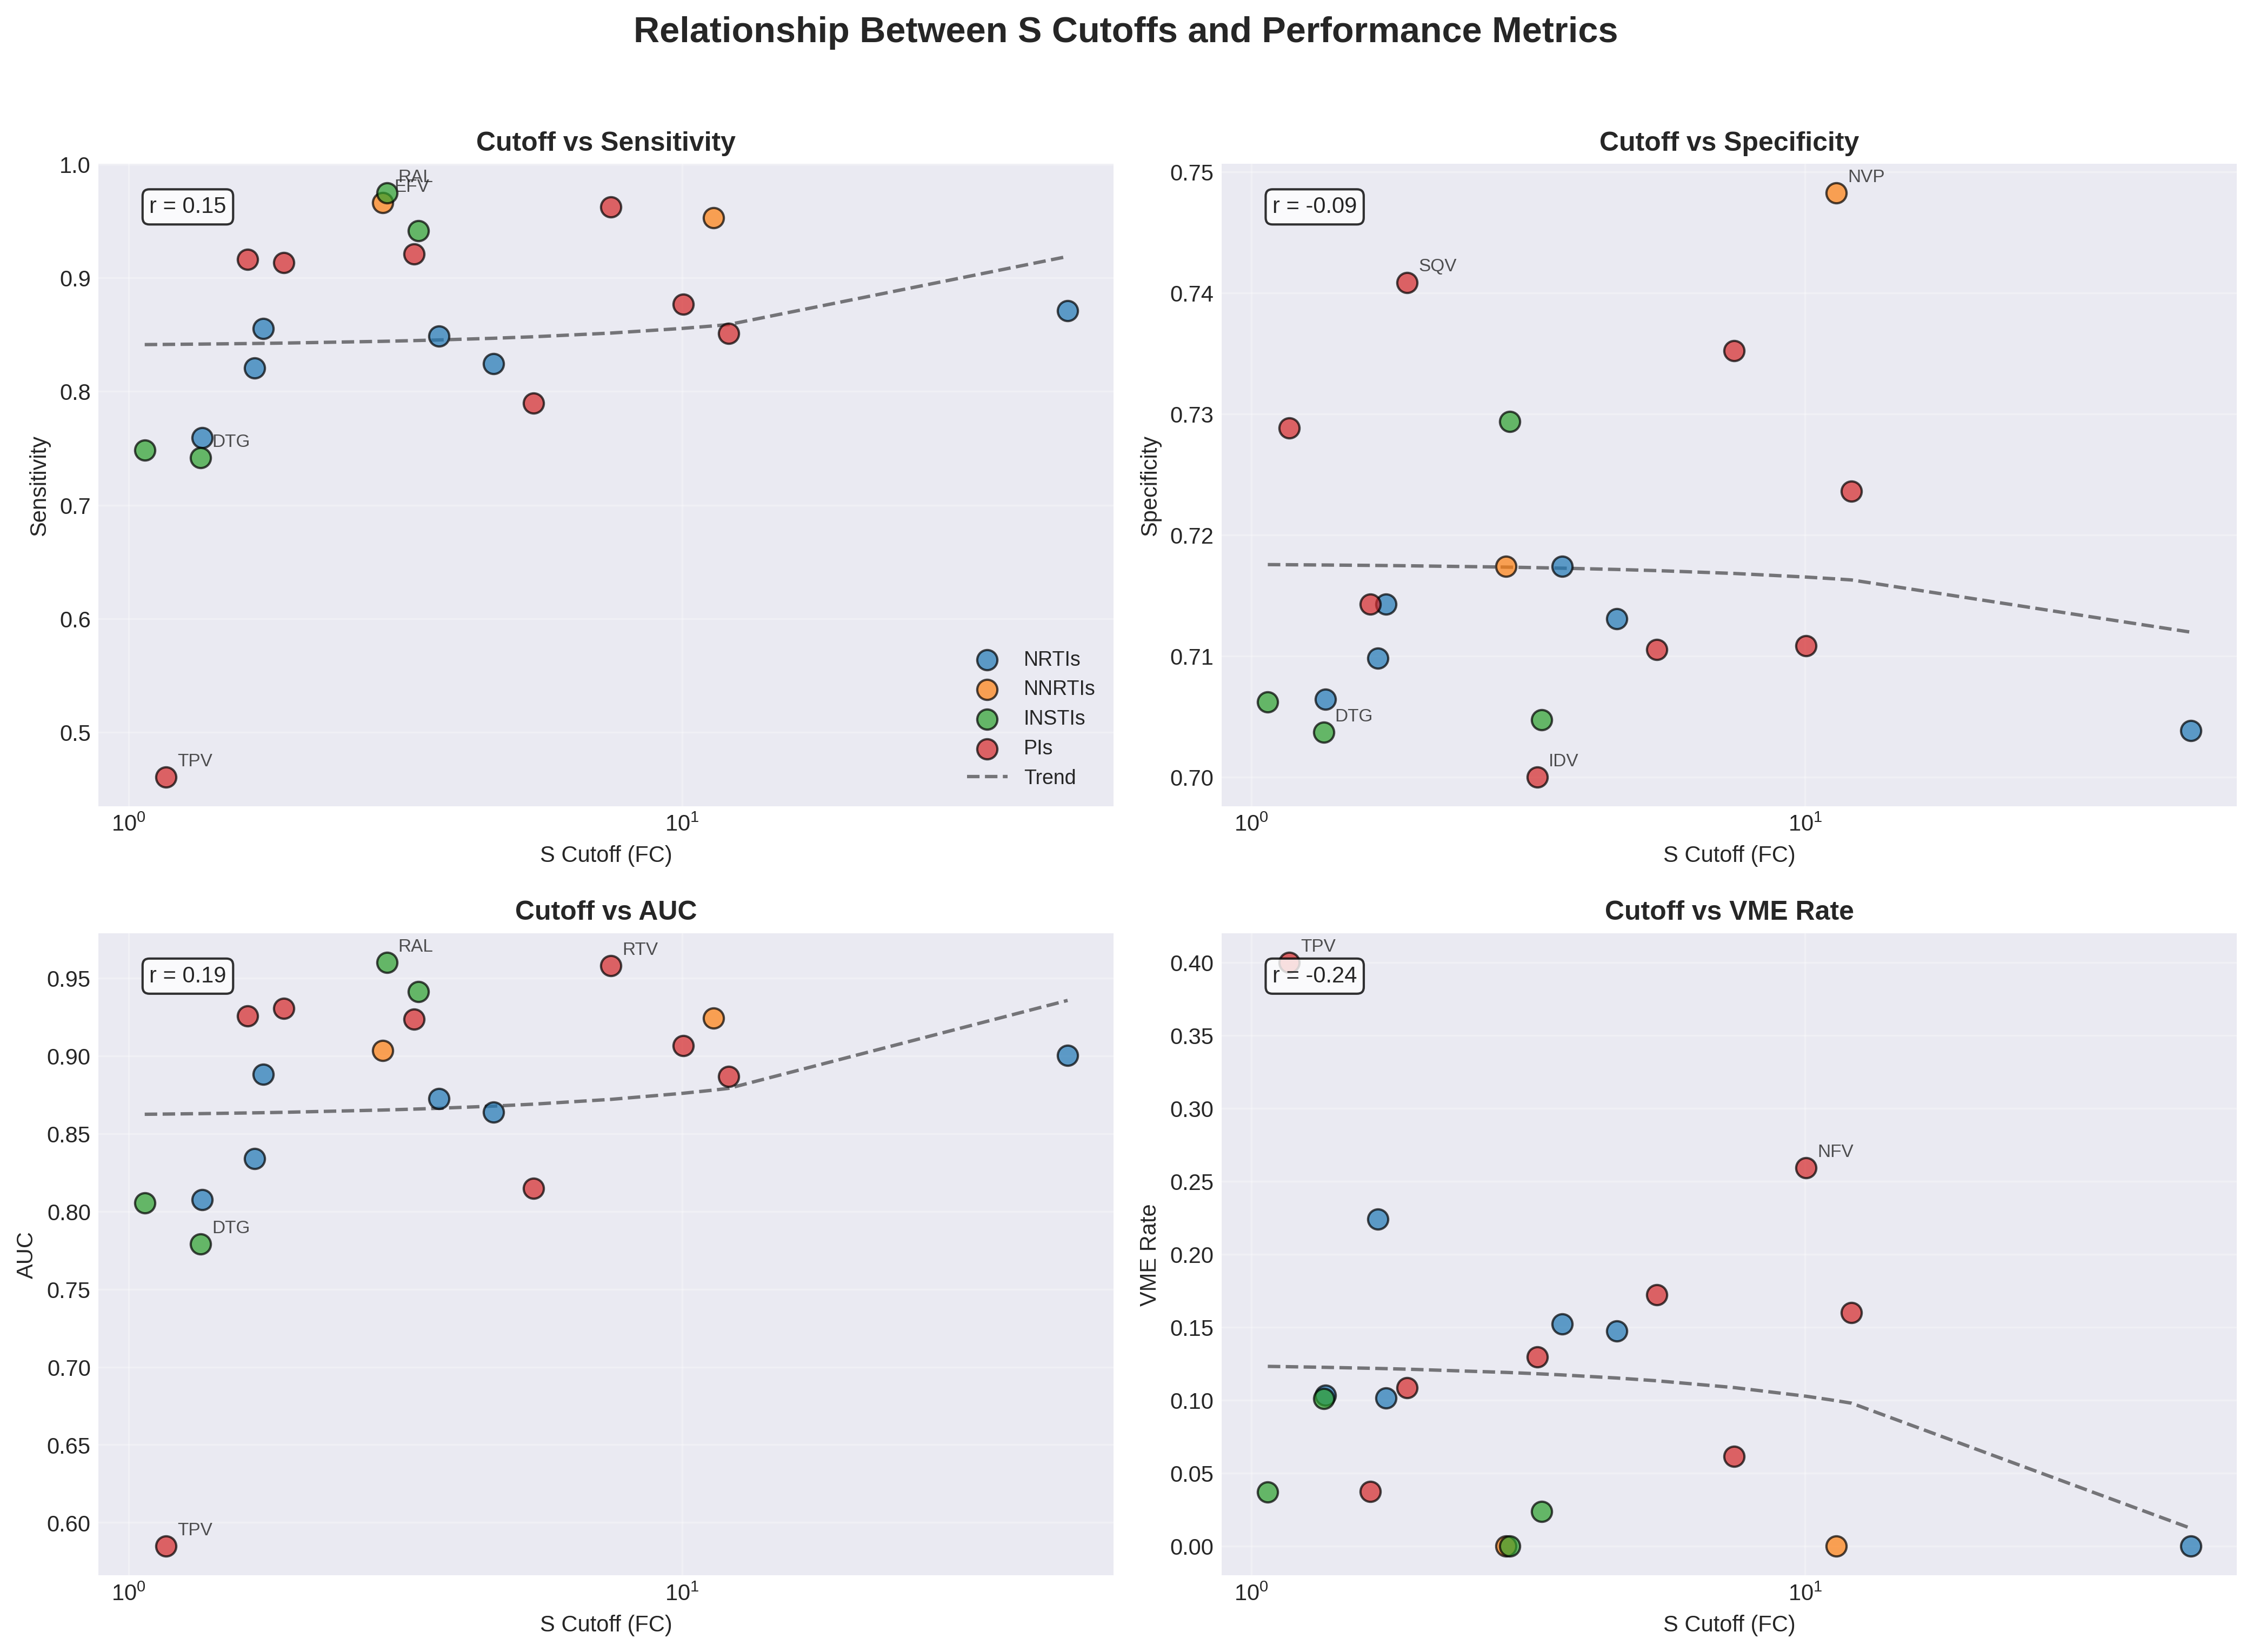
Sensitivity, specificity, and accuracy as functions of classification thresholds. Guides optimal threshold selection for clinical decision-making.
Classification Performance Analysis
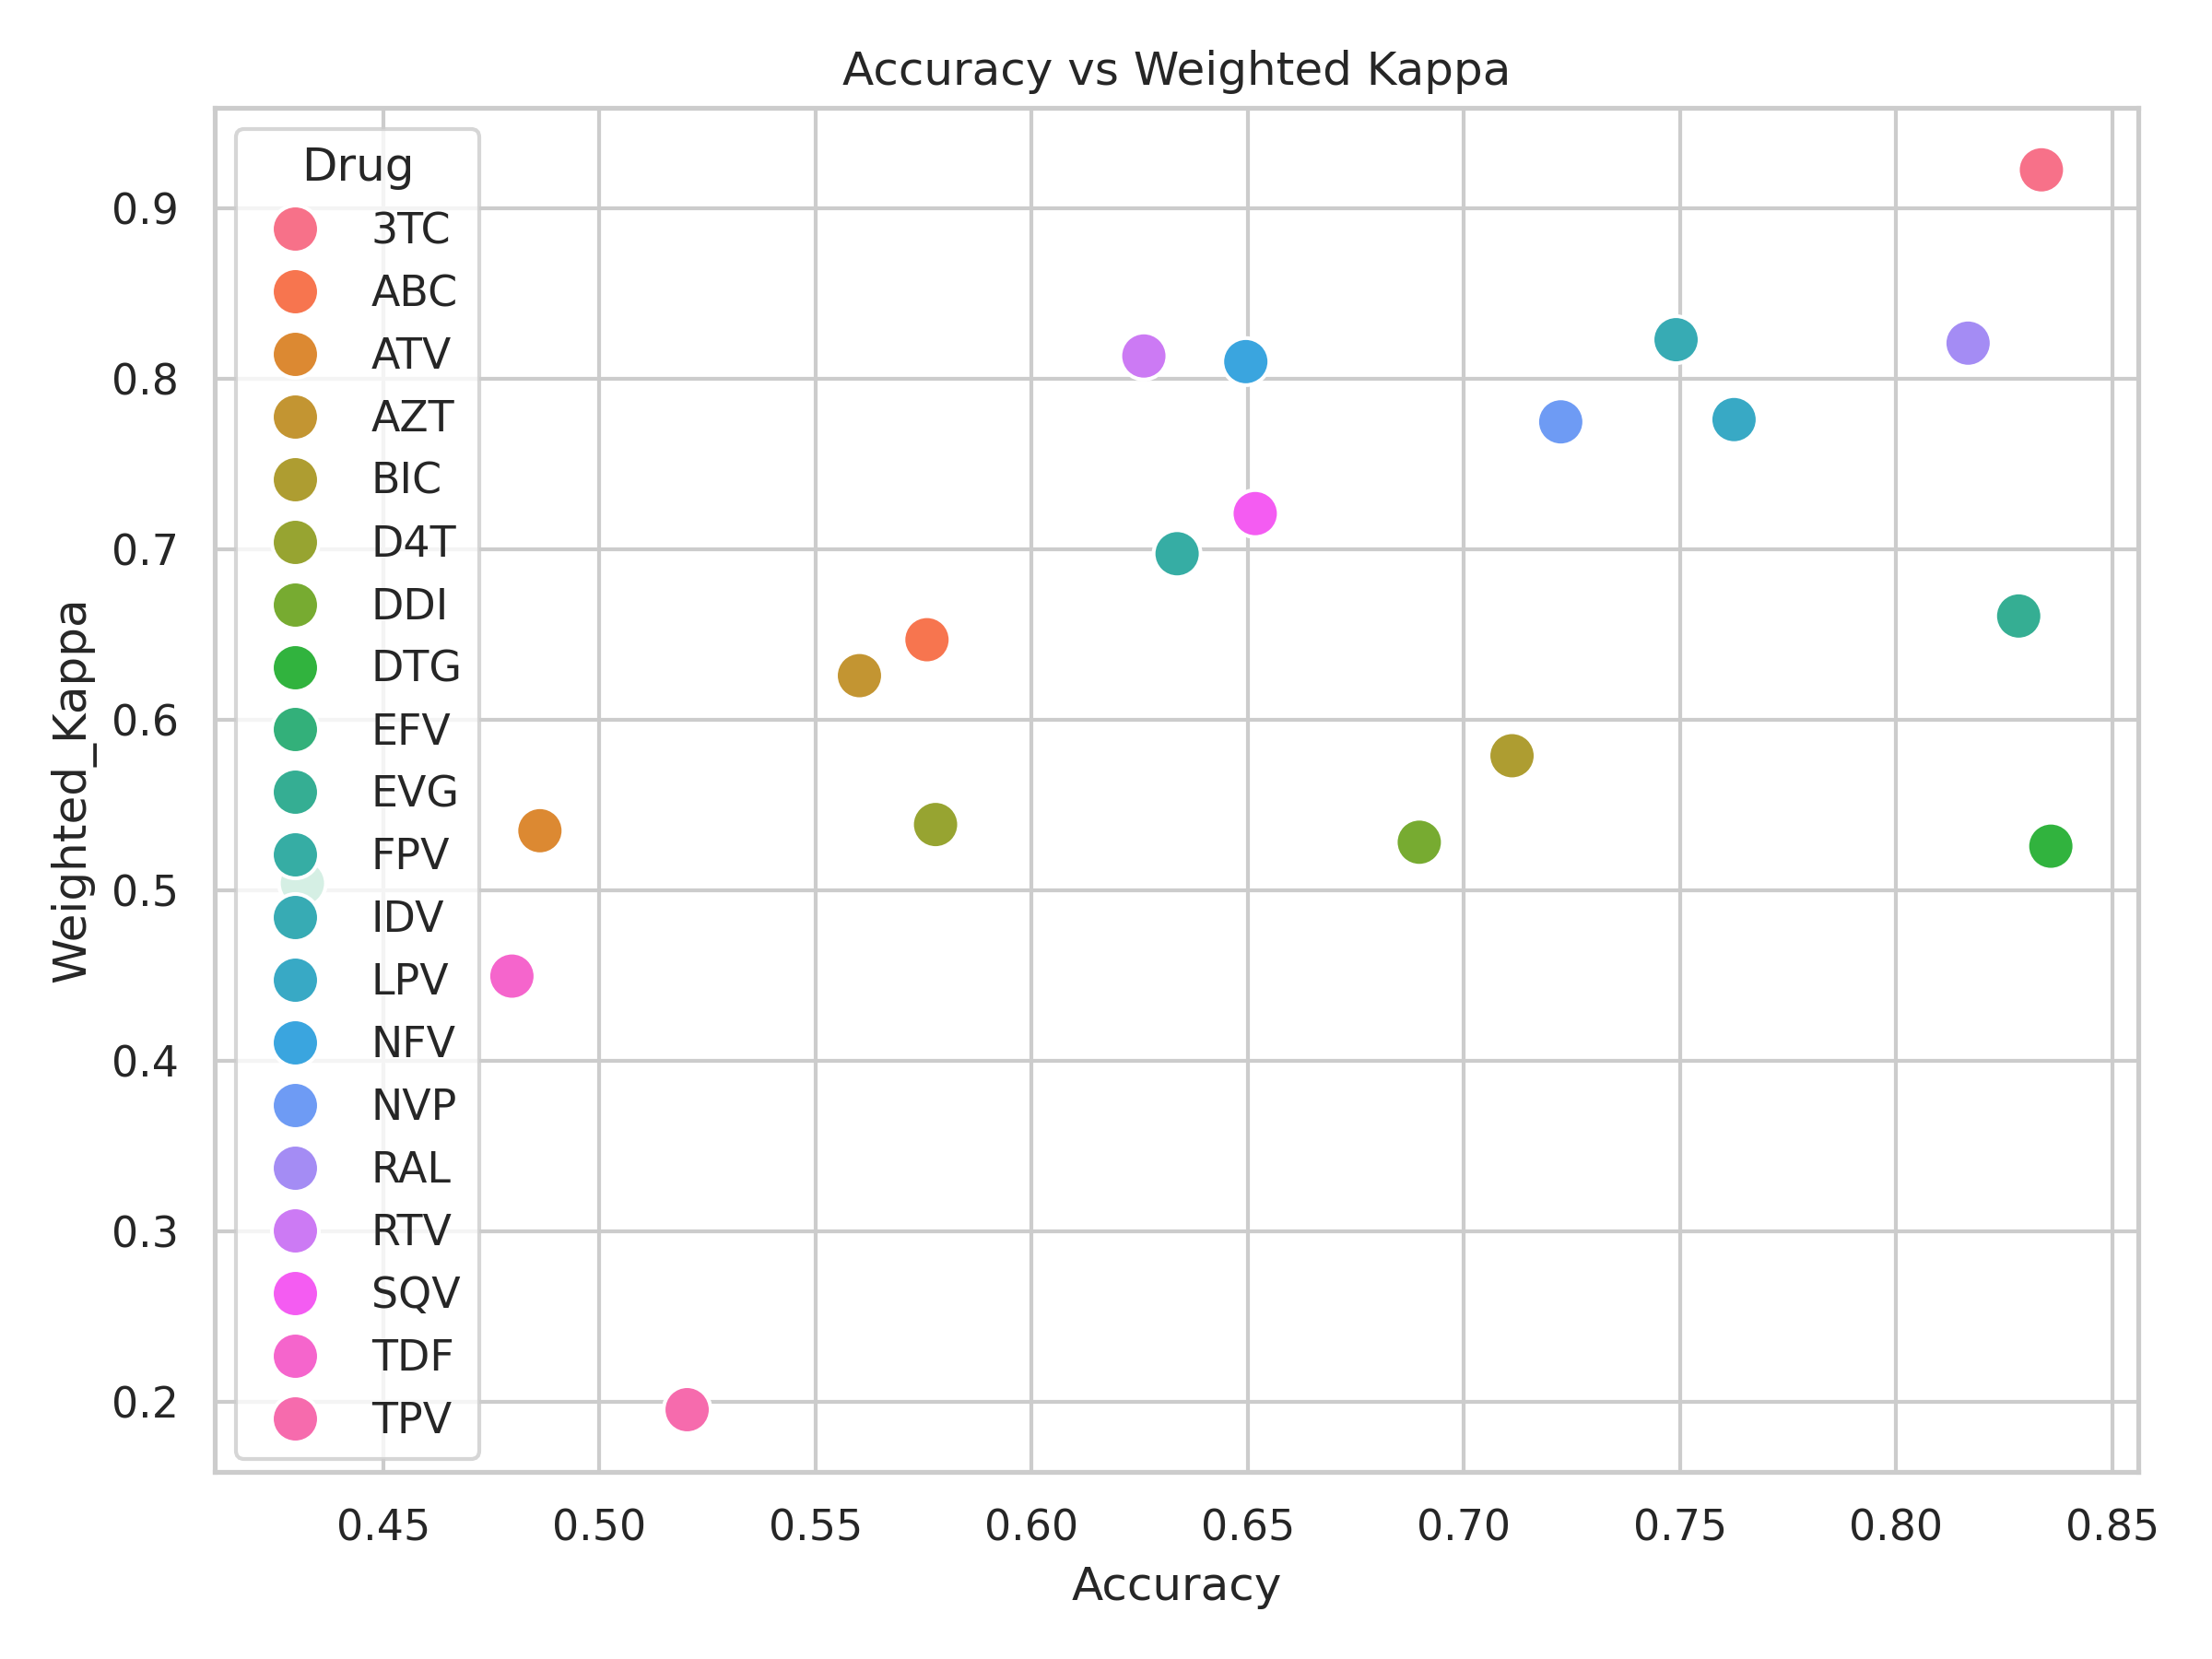
Relationship between accuracy and weighted Cohen's kappa across different drugs. Evaluates classification reliability accounting for class imbalance.
Mutation Network Analysis
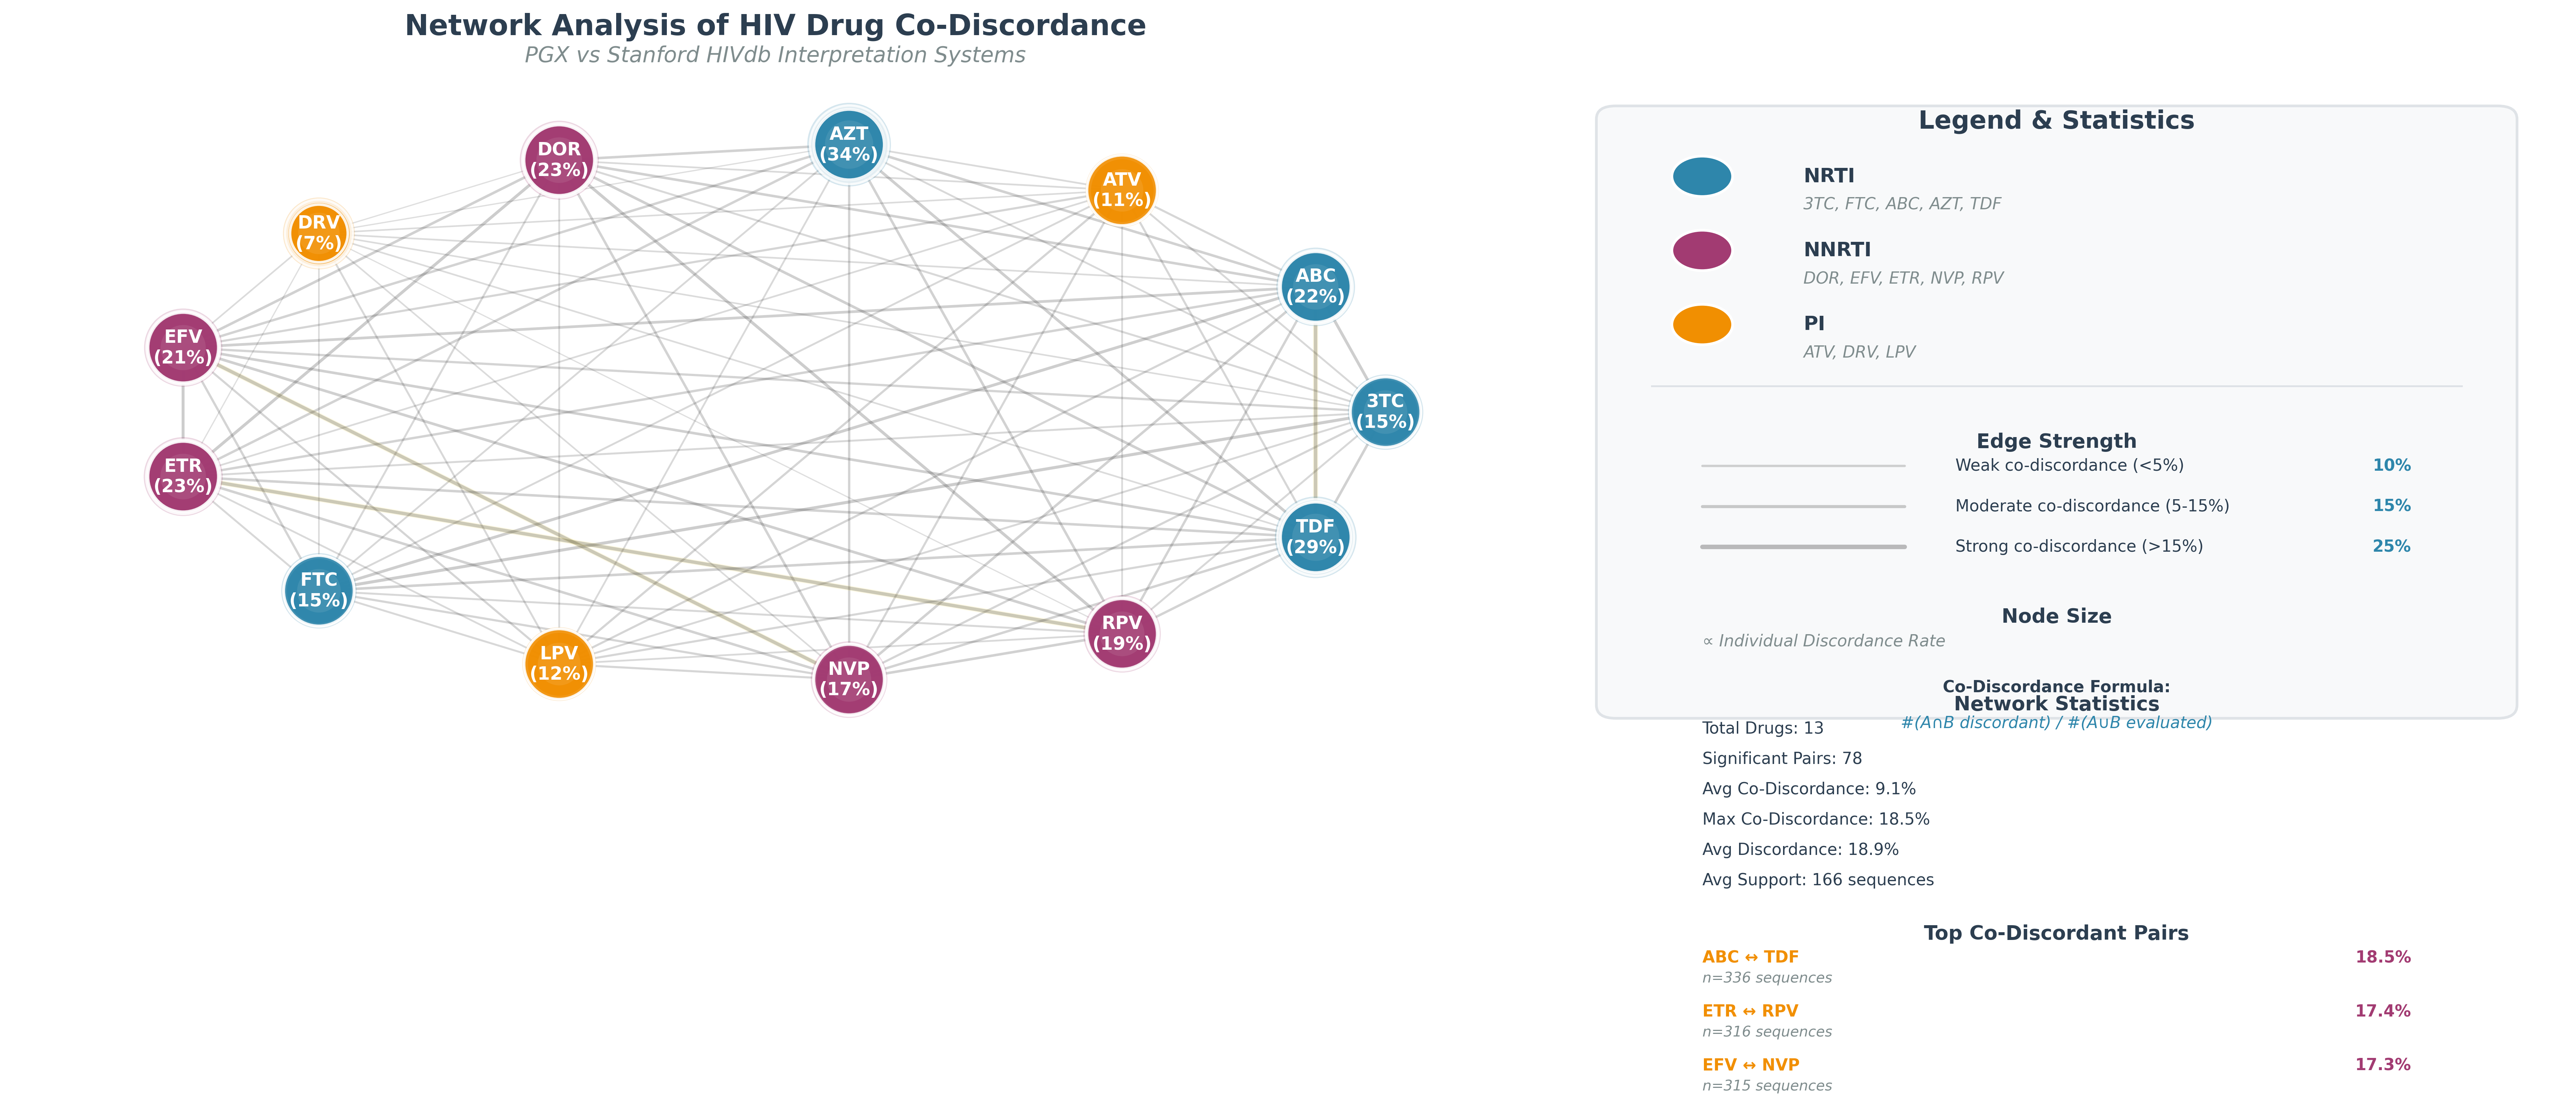
Network visualization of mutation co-occurrence patterns and their associations with drug resistance. Reveals complex mutation interactions.
PhenoGenX Score Distribution
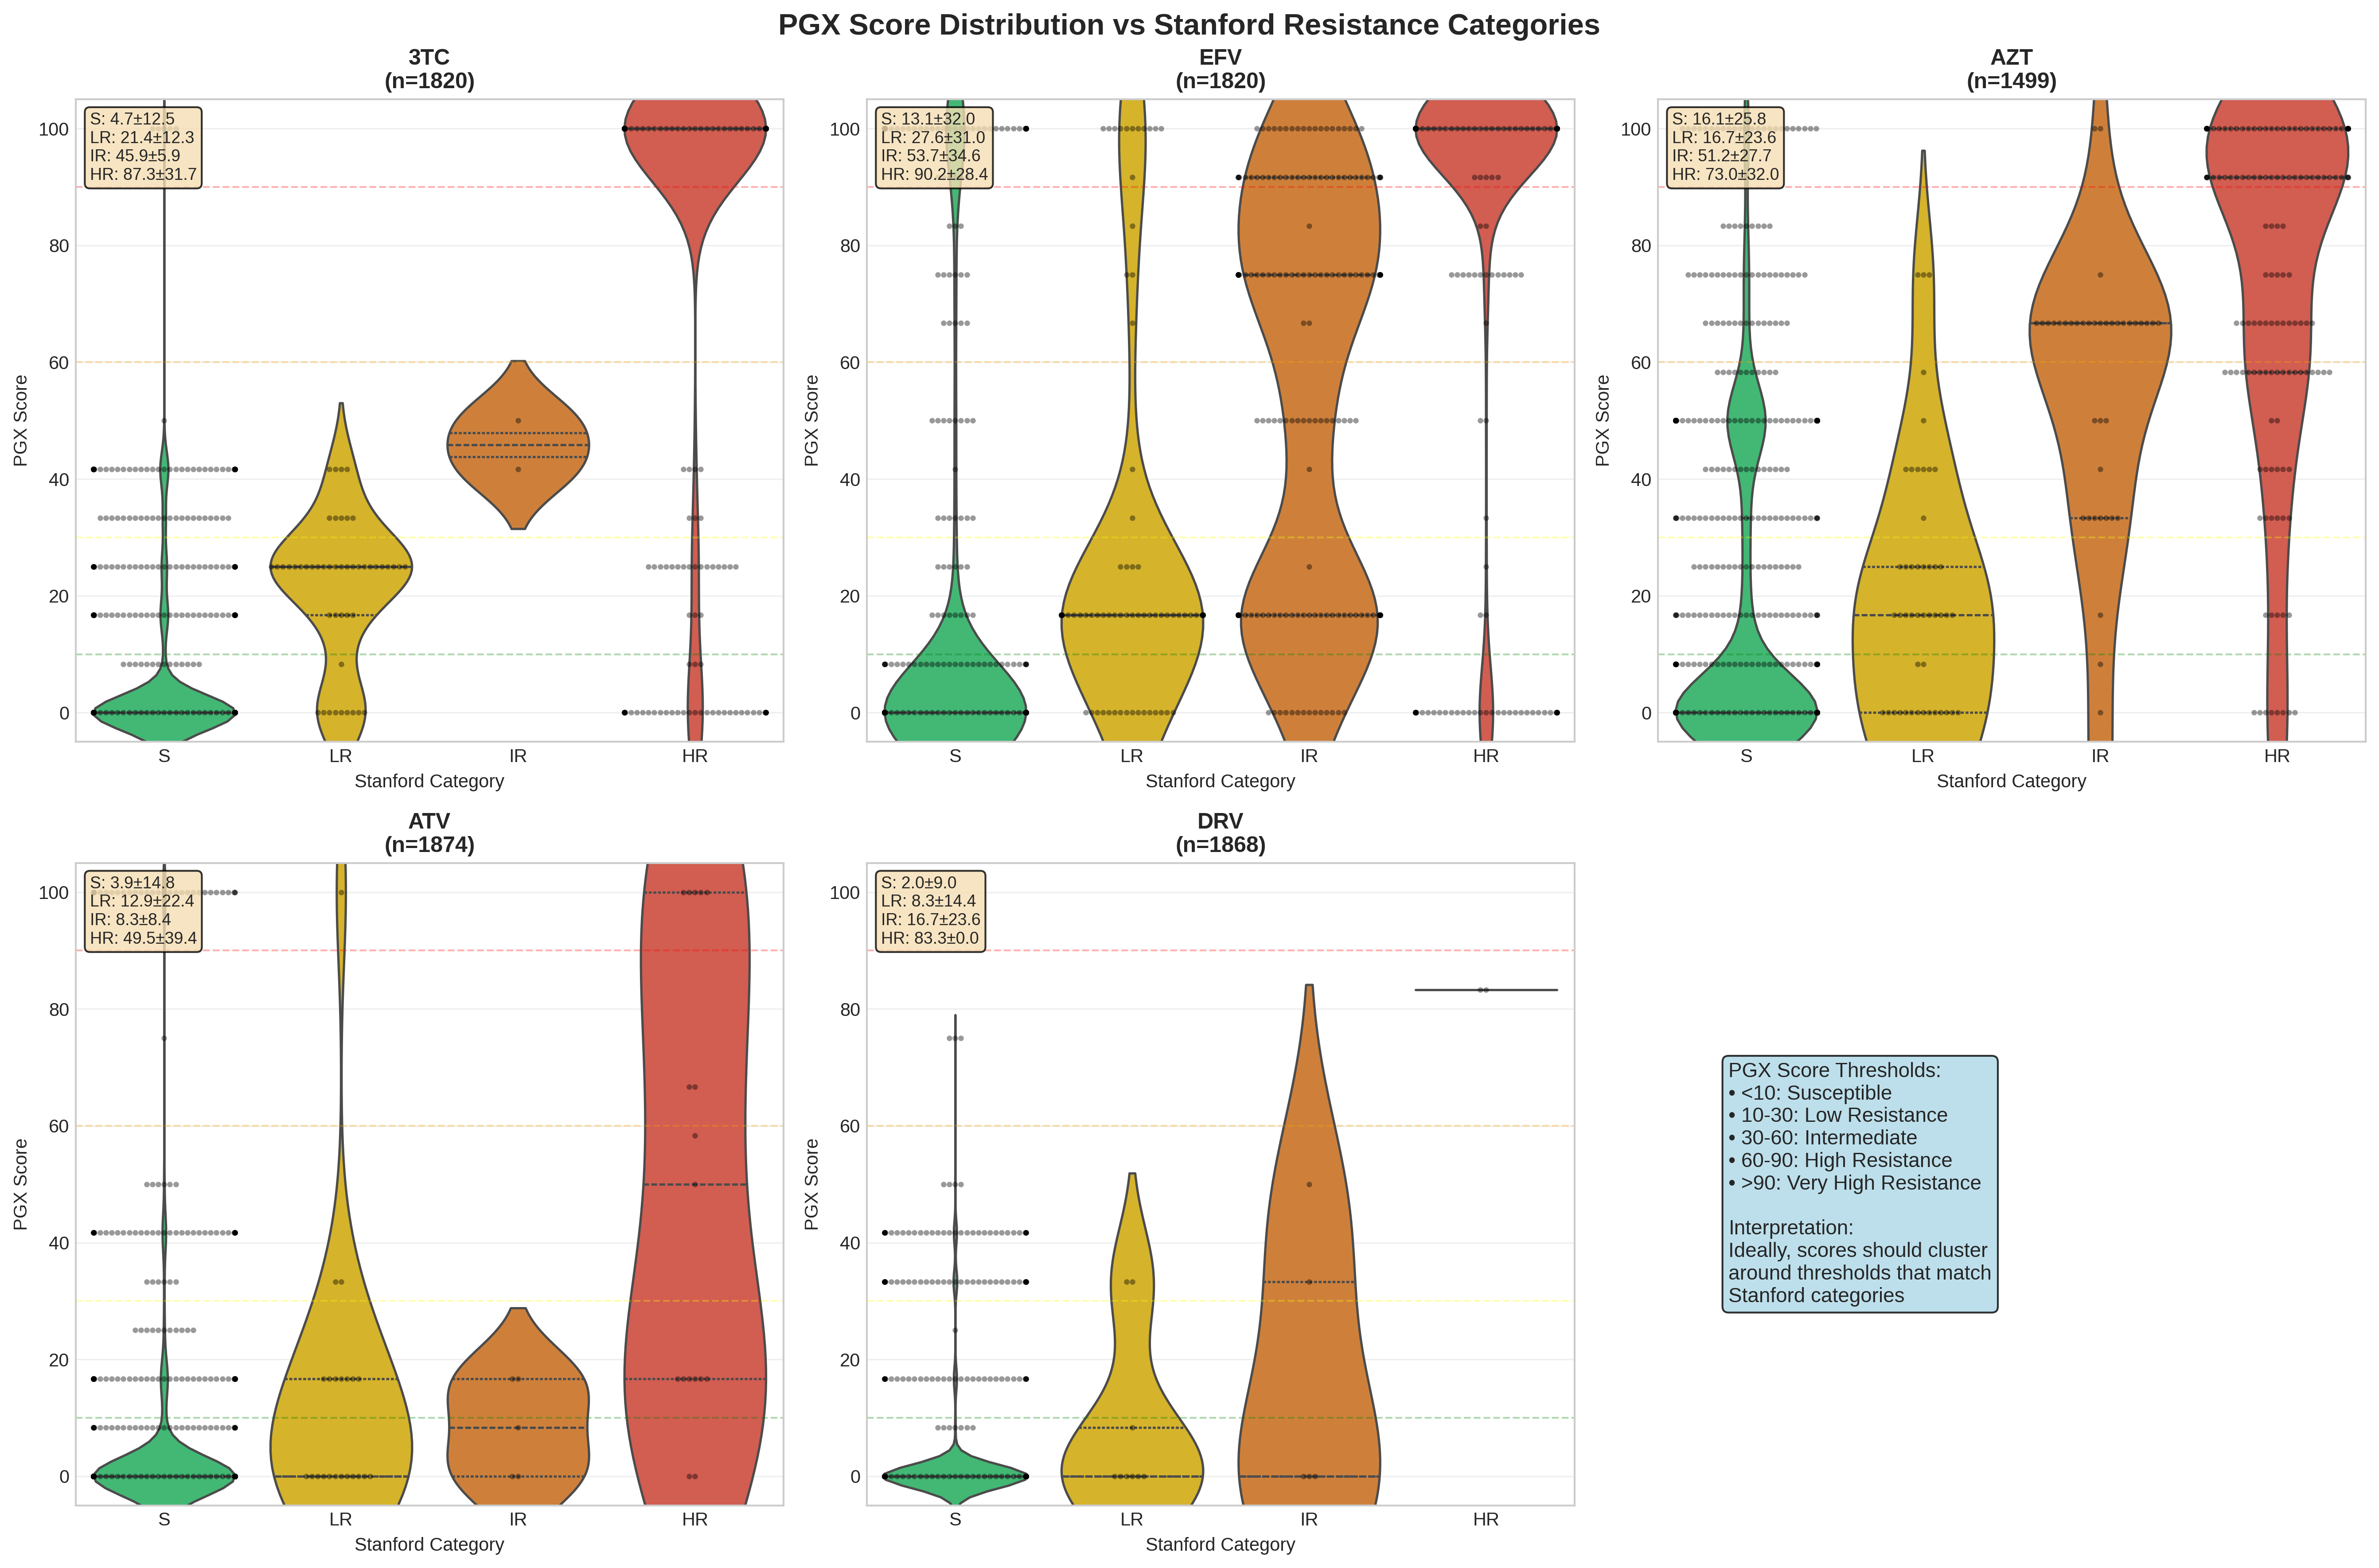
Distribution of PhenoGenX resistance scores across different drug classes. Shows model output characteristics and score ranges.
Enhanced Score Distribution Analysis
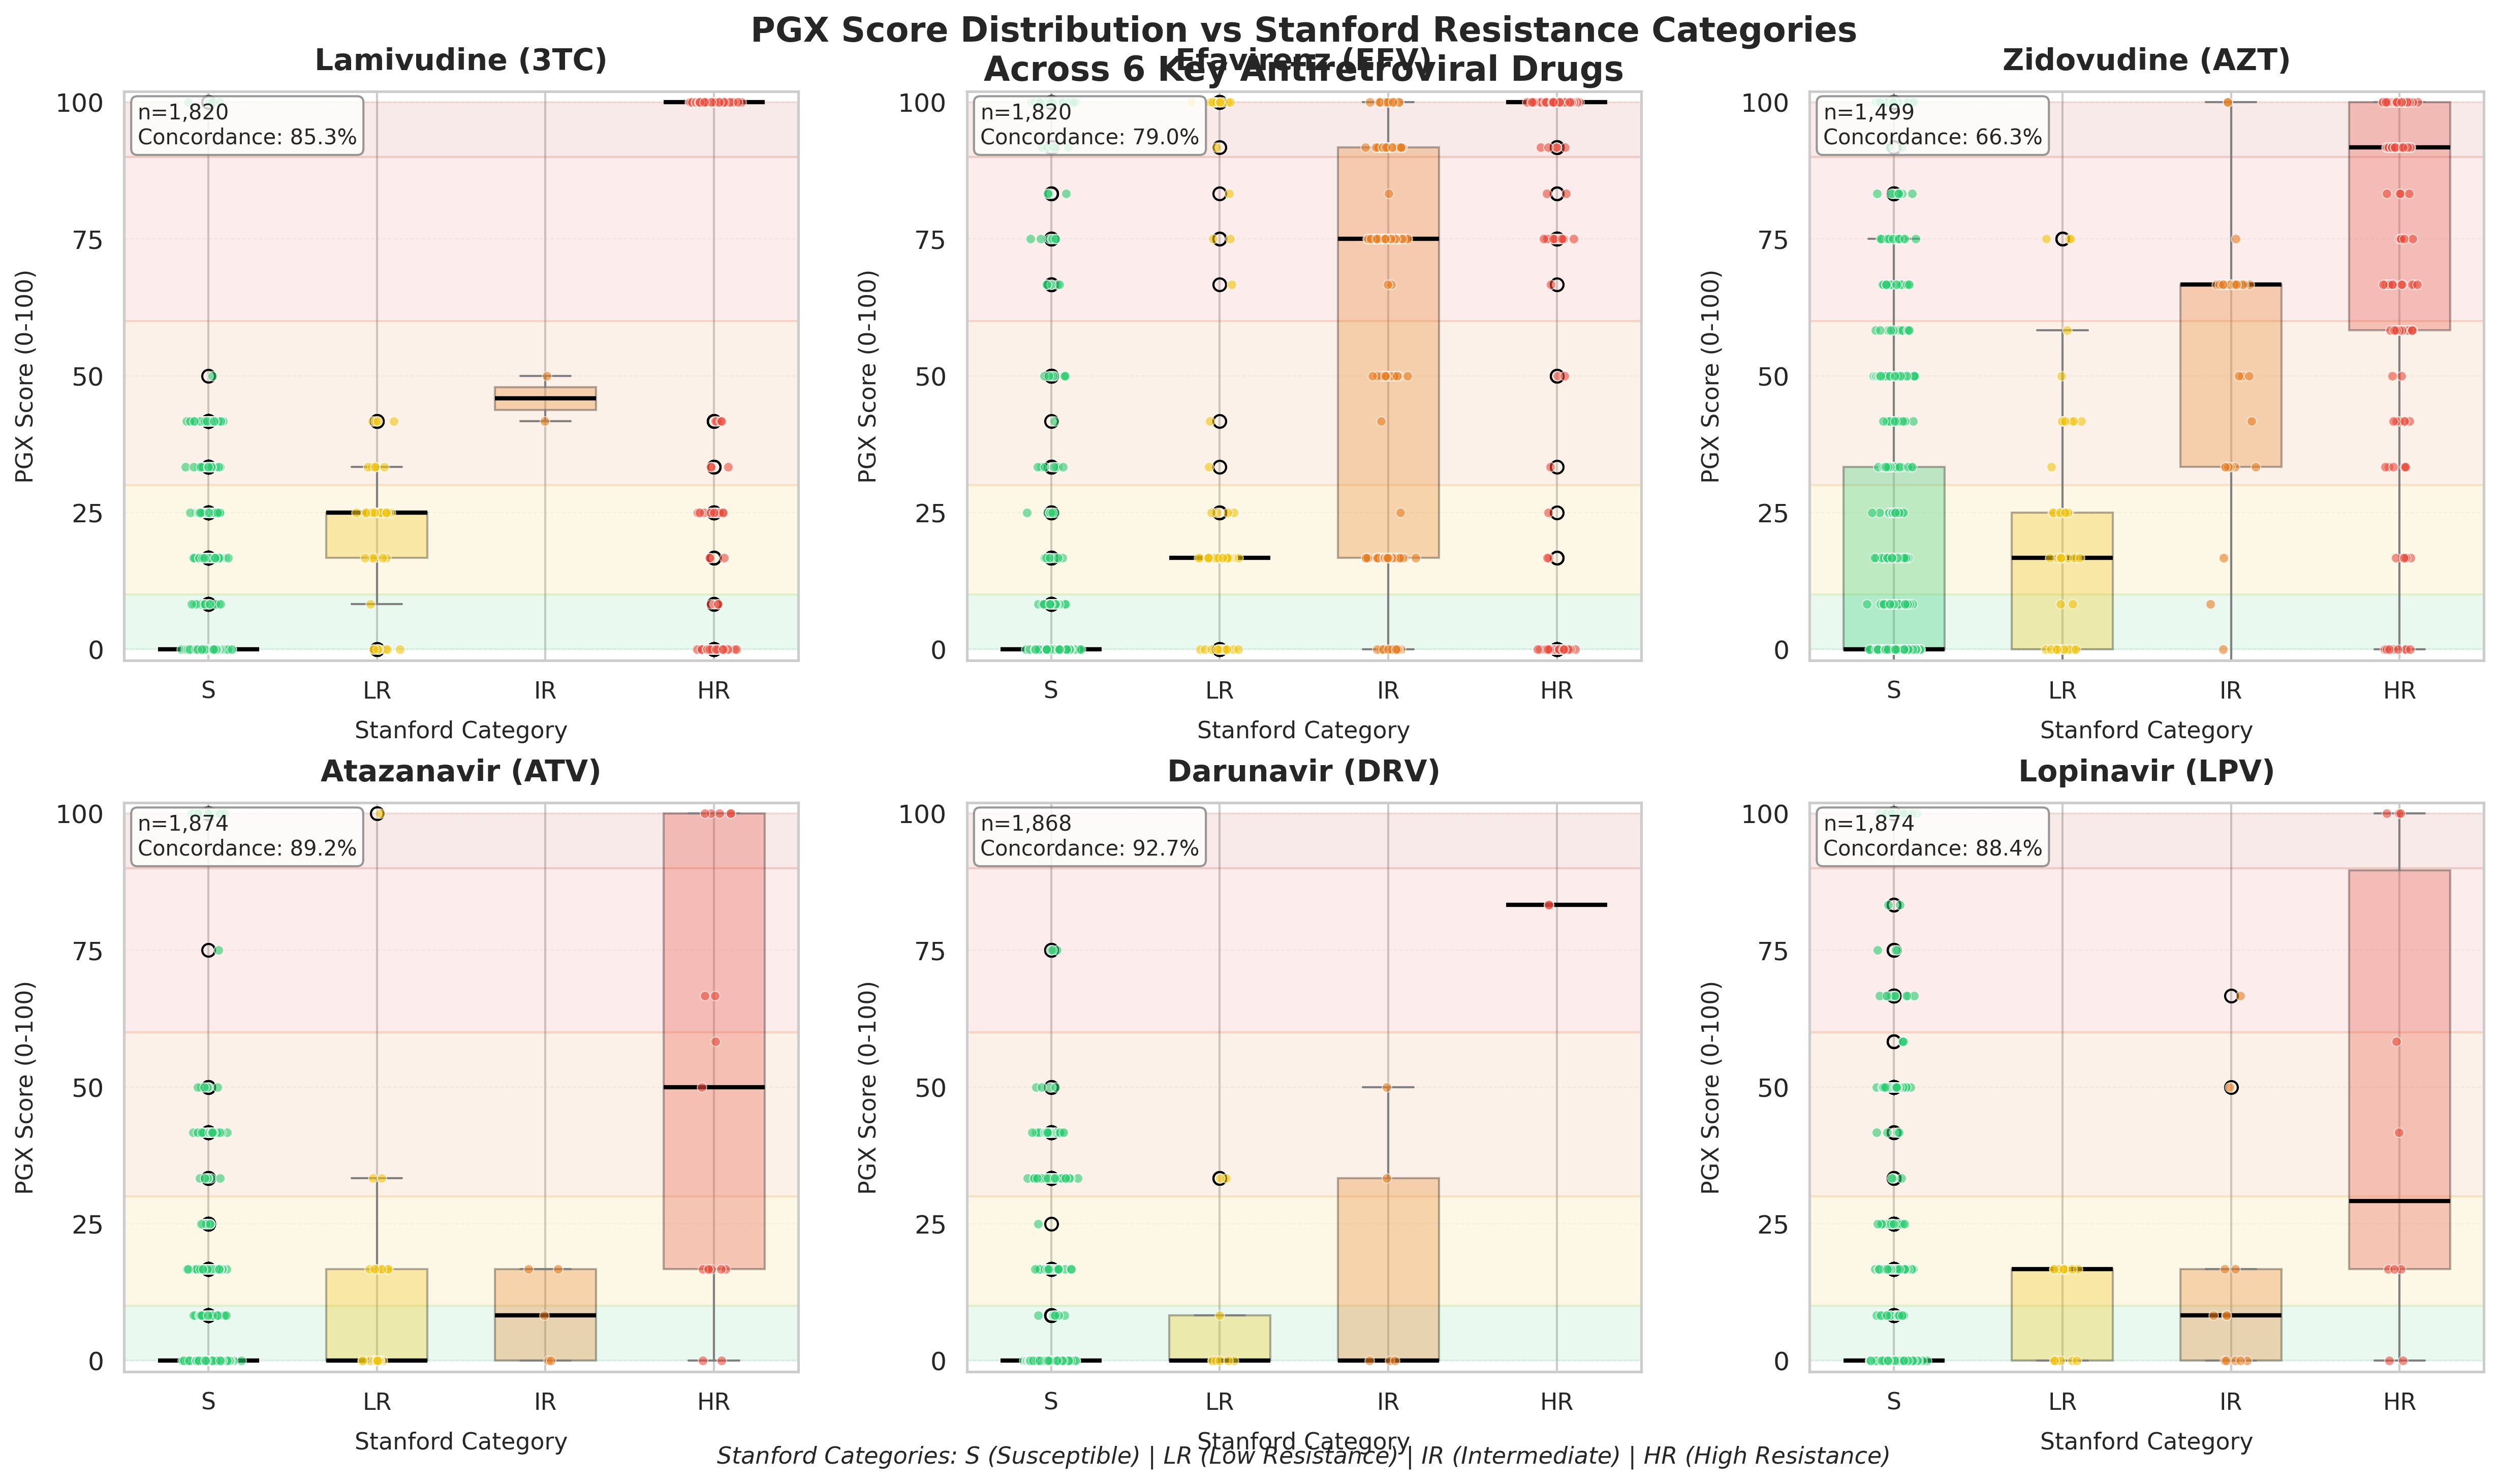
Comprehensive analysis of PhenoGenX score distributions with kernel density estimation. Provides detailed insights into model output characteristics, including multi-modal distributions and class separability across different resistance categories.
Visualization Notes
Dynamic Loading: All visualizations are loaded from /static/images/ directory.
Images are automatically refreshed when new validation results are available.
Interactive Features: Hover over images to see enhanced details. Click on any visualization to view it in full-screen mode for detailed inspection.
Image Generation: These visualizations are automatically generated during model validation and provide comprehensive insights into model performance across different dimensions.